LANCE: learning enzyme kinetics
Bach Pham, Kinjal Mondal & Jeffery B. Klauda
University of Maryland | Manuscript under mentor review | Not yet published
Enzyme measurements are sparse and depend on experimental conditions. LANCE predicts kcat, Km, and Ki with one shared architecture and three prediction heads.
One model, three predictions
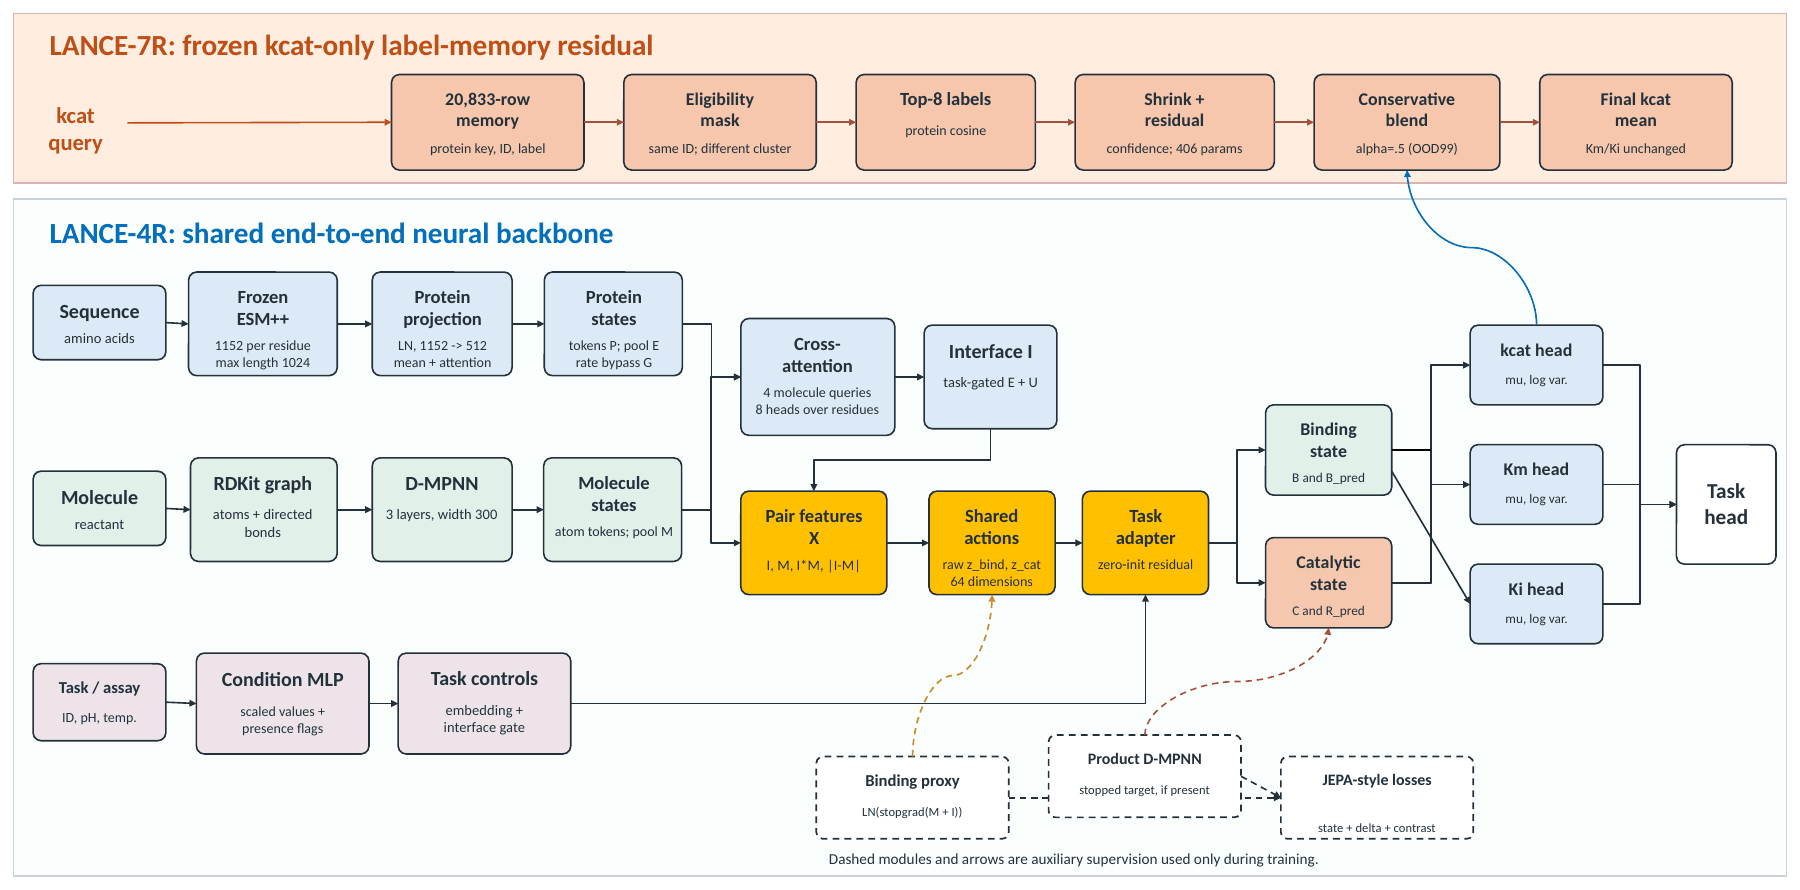
The core idea of my architecture is to implement the JEPA-style objectives.
Joint-Embedding Predictive Architecture (JEPA)-style learning guides two latent routes with different roles. Molecule-conditioned cross-attention first connects molecular features with enzyme residue features. Two shared 64-dimensional action vectors, adapted for each task, then update separate binding and catalytic representations:
- Reaction JEPA uses available products during training to help the catalytic route predict a product representation from the reactant representation rather than reconstructing the product.
- Binding JEPA uses a product-free target to guide the binding route toward a representation combining the molecule and enzyme interface.
Products are not required at inference. LANCE-7R also adds a second stage with just 406 fitted parameters. It retrieves stored training measurements for an exactly matching reactant, excluding the query's sequence-99 cluster, to adjust kcat predictions while leaving Km and Ki unchanged. Without an eligible exact match, the original neural prediction is preserved. This gives turnover a selective correction without retraining the shared backbone.
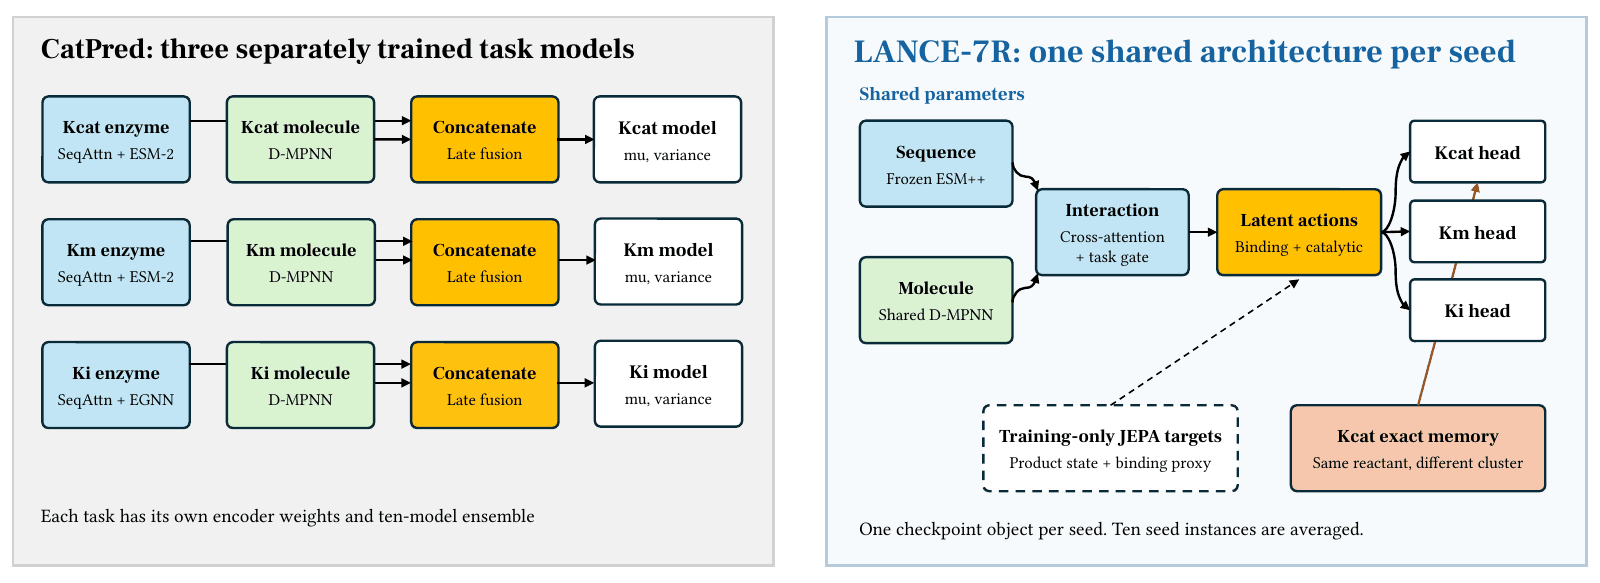
LANCE-7R vs. CatPred
We retrained CatPred v1.0.0 on the same CatPred-DB split using ten independent runs per task and evaluated both systems on exactly matched rows.
LANCE-7R has favorable point estimates in 18 of 18 Heldout/OOD99 comparisons and 41 of 48 comparisons across all supplied Heldout and sequence-OOD cohorts.
On the 348-row turnover OOD99 cohort, R^2 improves from 0.323 to 0.395 and MAE falls from 1.024 to 0.979. On 1,193 held-out inhibition measurements, MAE falls from 0.865 to 0.788. These results measure the complete system; they do not establish how much of the gain comes from either JEPA objective alone.
Bold indicates the better point estimate. n is the number of evaluated rows.
| Target / cohort | CatPred | LANCE-7R |
|---|---|---|
| kcat | Heldoutn = 2,317 | 0.611 | 0.651 |
| kcat | OOD99n = 348 | 0.323 | 0.395 |
| kcat | OOD80n = 306 | 0.271 | 0.341 |
| kcat | OOD60n = 243 | 0.221 | 0.287 |
| kcat | OOD40n = 160 | 0.145 | 0.224 |
| kcat | OOD20n = 104 | 0.126 | 0.157 |
| Km | Heldoutn = 4,117 | 0.649 | 0.672 |
| Km | OOD99n = 479 | 0.540 | 0.549 |
| Km | OOD80n = 380 | 0.551 | 0.560 |
| Km | OOD60n = 282 | 0.549 | 0.553 |
| Km | OOD40n = 173 | 0.483 | 0.474 |
| Ki | Heldoutn = 1,193 | 0.633 | 0.674 |
| Ki | OOD99n = 140 | 0.471 | 0.524 |
| Ki | OOD80n = 122 | 0.382 | 0.433 |
| Ki | OOD60n = 101 | 0.350 | 0.428 |
| Ki | OOD40n = 70 | 0.374 | 0.322 |
| Target / cohort | CatPred | LANCE-7R |
|---|---|---|
| kcat | Heldoutn = 2,317 | 0.701 | 0.657 |
| kcat | OOD99n = 348 | 1.024 | 0.979 |
| kcat | OOD80n = 306 | 1.046 | 1.003 |
| kcat | OOD60n = 243 | 1.117 | 1.075 |
| kcat | OOD40n = 160 | 1.223 | 1.161 |
| kcat | OOD20n = 104 | 1.346 | 1.323 |
| Km | Heldoutn = 4,117 | 0.547 | 0.517 |
| Km | OOD99n = 479 | 0.648 | 0.632 |
| Km | OOD80n = 380 | 0.660 | 0.645 |
| Km | OOD60n = 282 | 0.689 | 0.678 |
| Km | OOD40n = 173 | 0.766 | 0.774 |
| Ki | Heldoutn = 1,193 | 0.865 | 0.788 |
| Ki | OOD99n = 140 | 0.994 | 0.941 |
| Ki | OOD80n = 122 | 1.045 | 1.010 |
| Ki | OOD60n = 101 | 1.051 | 1.008 |
| Ki | OOD40n = 70 | 1.050 | 1.121 |
| Target / cohort | CatPred | LANCE-7R |
|---|---|---|
| kcat | Heldoutn = 2,317 | 77.68 | 80.02 |
| kcat | OOD99n = 348 | 61.81 | 62.36 |
| kcat | OOD80n = 306 | 61.37 | 61.44 |
| kcat | OOD60n = 243 | 58.27 | 58.02 |
| kcat | OOD40n = 160 | 54.44 | 55.62 |
| kcat | OOD20n = 104 | 49.13 | 48.08 |
| Km | Heldoutn = 4,117 | 84.63 | 85.94 |
| Km | OOD99n = 479 | 79.46 | 79.96 |
| Km | OOD80n = 380 | 77.82 | 78.68 |
| Km | OOD60n = 282 | 75.07 | 76.24 |
| Km | OOD40n = 173 | 70.46 | 71.10 |
| Ki | Heldoutn = 1,193 | 67.75 | 71.58 |
| Ki | OOD99n = 140 | 58.86 | 63.57 |
| Ki | OOD80n = 122 | 55.57 | 59.84 |
| Ki | OOD60n = 101 | 57.23 | 59.41 |
| Ki | OOD40n = 70 | 56.71 | 54.29 |
CatPred: mean of ten outer ensembles. LANCE-7R: one selected ten-member ensemble. R^2 and MAE use log10 targets; P1mag (within 10x) is the percentage with absolute log10 error below 1. OOD labels are the supplied target-specific sequence-identity cohorts; Km and Ki have no supplied OOD20 rows. Counts summarize metric directions across nested cohorts, not statistical significance.